


Pedigree analysis of assumptions of environmental health risk indicator (ozone)
Introduction
This casestudy illustrates the application of assumption analysis and the pedigree matrix for assessing assumption for the case of uncertainty in quantitative environmental indicators presented in the Netherlands 5th Environmental Outlook (EO5). These indicators are based on scenario calculations with a whole chain of soft-linked computer models –varying in complexity. Many assumptions have been made in combining research results in these calculation chains, especially since the output of one computer model often does not fit the requirements of input for the next model (scales, aggregation levels). The casestudy focusses on one EO5 indicator: ‘deaths and emergency hospital admittances due with tropospheric ozone’.
Method
Table 2 presents the pedigree matrix used in this study. In the workshop, the experts indicated on scoring cards (one card for each assumption) how they judge the assumption on the pedigree criteria and how much influence they think the assumption has on results. An essential part of our method is that a moderated group-discussion takes place in which arguments for high or low scores per criterion are exchanged and discussed. In this way experts in the group remedy each other's blind spots, which enriches the quality of the individual expert judgments. We deliberately did not ask a consensus judgment of the group, because we consider expert disagreement a relevant dimension of uncertainty.
Assumptions that have at the same time a high influence on the results and a low pedigree can be qualified as ‘weak links’ in the chain of which the user of the assessment results needs to be particularly aware.

Pedigree matrix for reviewing the knowledge base of assumptions
Results
Analysis of the calculation chain of the indicator ‘deaths and hospital admittances due to exposure to ozone’ yielded a list of 24 assumptions. 14 key-assumptions were selected by the workshop participants as the most important ones, and prioritized. Combining the results of pedigree analysis and estimated influence in a diagnostic diagram (see below) identified the following assumptions as the weakest links of the calculation chain: Assumption that uncertainty in the indicator is only determined by the uncertainty in the Relative Risk (RR is the probability of developing a disease in an exposed group relative to those of a non-exposed group as a function of ozone exposure) and the assumption that the global background concentration of ozone is constant over the 30 year time horizon. The full EO5 case and method for the review of assumptions is documented in Kloprogge et al. (2005; in press).
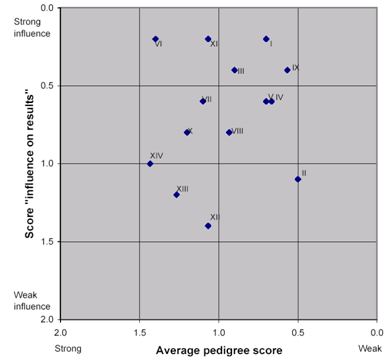 |
Labels of Assumptions plotted:
I Uncertainty in Relative Risk (RR) dominates
II emissions abroad will not differ in EC & GC scenarios
III O3 is homogeneously distributed over model grid cells
IV worst case metrological circumstances will not change over time
V developments in emission factors and volume growth are harmonized in European context
VI changes in the composition of the air pollution mix will not lead to changes in RR
VII linear dose-effect relationship
VIII O3 concentration is representative for exposure
IX global background concentration of ozone is constant
X 2010 emissions abroad meet national emission ceilings
XI Dutch epidemiological data are adequate for the whole of the Netherlands
XII 2010-'30 Sectoral emissions abroad follow NL pattern
XIII Direct causal relationship between ozone and death
XIV CPB scenarios were suitable for exploring NL societal-demographical developments
|
Conclusion
global background concentration of ozone is constant over the 30-year time horizon; (ii) the assumption that the worst case meteorological
circumstances remain constant over time; and (iii) the assumption that the developments in emission factors and volume growth are harmonized in the European context. In their evaluation of the application of the method, participants found that the main assumptions in the chain were indeed identified, that the pedigree criteria were clear and their scores meaningful.
The method can be applied during the development of the assessment or after the assessment has already been carried out. In the latter case insight will be gained in potentially value-laden assumptions in the chain, but if the assessment has already been finalized, revisions are no longer possible. If the assessment has already been documented it neither will be possible to include the insights of the analysis in the assessment documentation. It may help however in communication surrounding the assessment and in extended peer review of the assessment. Applying the method during the assessment process is preferred: changes can be made to improve the assessment, and the results of the assumption-analysis can be included in the documentation.
Full documentation of the case
P. Kloprogge, J.P. van der Sluijs and A.C. Petersen (in press). A method for the analysis of assumptions in model-based environmental assessments Environmental Modelling & Software
Doi: 10.1016/j.envsoft.2009.06.009
P. Kloprogge, J.P. van der Sluijs and Arthur Petersen, 2005. A method for the analysis of assumptions in assessments: Exploring the value-ladenness of two indicators in the Fifth Dutch Environmental Outlook report commissioned by: Netherlands Environmental Assessment Agency (MNP), report published by: Netherlands Environmental Assessment Agency (MNP), Bilthoven and Unit Science, Technology and Society, Copernicus Institute, Utrecht University, Utrecht, the Netherlands, December 2005, 69 pp.